Write your GDB scripts in Haskell
In this post, I will show how you can use the new debugger-hs library in Haskell to generate GDB scripts.
Debugging in GDB
Recently, I had to do lots of debugging in a C++ codebase using GDB at $DAY_JOB. While it is possible to start debugging by placing some breakpoints yourself for simple pieces of code, this quickly turns into a lot of manual and repetitive work for complex debugging sessions.
Thankfully, GDB allows you to script all these actions. A GDB script is a list of statements, and is executed from top to bottom. Here's an example of such script:
# This sets a breakpoint at line 8 in main.cpp
break main.cpp:8

# Breakpoints are numbered, starting from 1
# We can attach automatic actions to a breakpoint using "command" statement:
command 1
  # The next line prints the current value of the "x" variable
  print x
  # And then continue the program like normal (until next breakpoint)
  continue
end
If we run this script on the following C++ code, it would print out all values of x that are passed into the function f.
void f(int x) {
  // ...
}

int main(int argc, char** argv) {
  for (int x = 0; x < 100; ++x) {
    if (x % 10 == 0) {
      f(x);
    }
  }
  return 0;
}
Debugging using Haskell
GDB scripts already are a big improvement over manually typing in commands each time, but I still felt many things to be less than ideal:
- The scripting language in GDB doesn't always work as expected. For example, some GDB commands that normally print information to the screen do not print a value inside a user-defined function!
- Setting breakpoints and handling them is a 2-step process.
- There is no typesystem like in Haskell, issues in scripts are detected only when the line in the script is triggered. The resulting errors can also be very confusing.
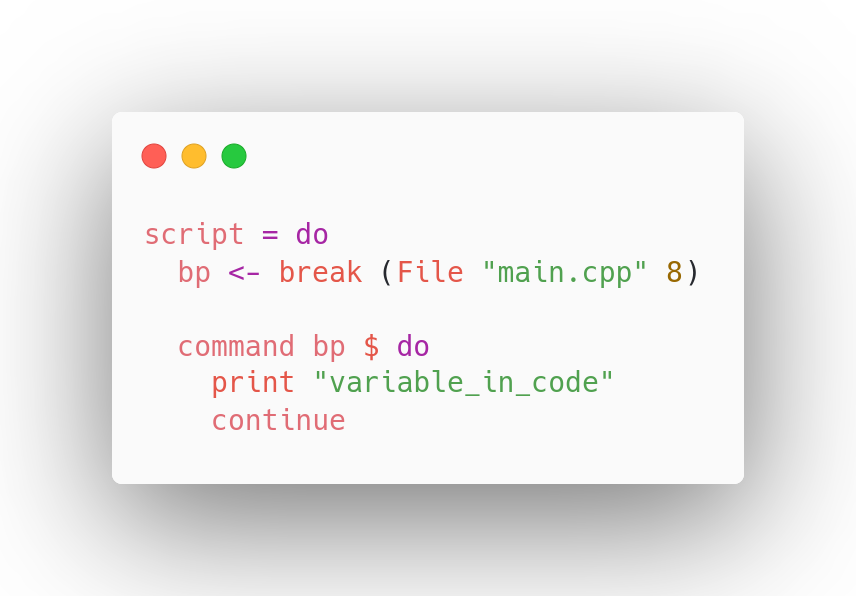
Instead of trying to keep track of all these oddities, I set out to write a library that tackles these issues. Here's what the same GDB script from before looks like using debugger-hs:
-- GDB scripts are constructed using a builder-pattern
script :: Builder ()
script = do
  -- Setting a breakpoint returns the corresponding breakpoint id
  bp <- break (File "main.cpp" 8)

  command bp $ do
    print "x"
    continue

main :: IO ()
main = do
  let gdbScript = runBuilder script
  renderIO gdbScript "./script.gdb"
As you can see, it looks similar to the original script thanks to do-syntax and the EDSL that debugger-hs provides. When the Haskell code is executed, a GDB script is generated and saved as "script.gdb":
break main.cpp:8
set $var0 = $bpnum

command $var0
  print x
  continue
end
The script has the same behavior as before, but you may notice there's an extra statement: $var0 is set to $bpnum. $bpnum is a magic variable that GDB uses to always keep track of the last breakpoint id that was generated. By setting $var0 to this value, it makes it possible in the Haskell DSL to always know the id of the last set breakpoint (since $bpnum keeps changing with each breakpoint). The library manages all this automatically, making it possible to build other abstractions on top (as we will see in the next section).
Another thing to note is that once the Haskell code finishes executing, the produced script no longer contains any Haskell and consists 100% of GDB statements. This avoids potential lock-in to the library and it might also make it easier to introduce Haskell into the workplace.
A more complex example
One situation that I often ran into while debugging was that I had to check if certain places in the code were triggered sequentially in order. In GDB, you could do this with a script that looks as follows:
break func1

command 1
    break func2

    command 2
        ...
    end

    continue
end
While this works, it gets unwieldy very fast with the ever increasing indentation. I would much rather write code that handles the first breakpoint and then handle the later breakpoints. If you've been coding in Haskell for some time, you know where I'm going with this.. 😉
With debugger-hs, we can fix this problem by making good use of abstractions in Haskell. First we define a helper function that sets a breakpoint and then configures the actions that need to be run when the breakpoint is triggered:
withBreakpoint :: Location -> (Id -> Builder ()) -> Builder ()
withBreakpoint loc f = do
  bp <- break loc
  command bp $ f bp
With this helper function, we can now write code like this:
script :: Builder ()
script = do
  withBreakpoint (Function "func1") $ \bp1 -> do
    withBreakpoint (Function "func2") $ \bp2 -> do
      _  -- ...
The indentation issue is still present, but our code is better factored now that the creation and processing of a breakpoint is handled in one place. But, we're not done yet. If you look closely, you'll see that we are making use of continuations now. This allows us to take the refactoring one step further using the continuation monad from Control.Monad.Cont:
script :: Builder ()
script = flip runContT handleResult $ do
  bp1 <- ContT $ withBreakpoint (Function "func1")
  bp2 <- ContT $ withBreakpoint (Function "func2")
  -- ...
  where
    handleResult _ = pure ()
The indentation is completely flat now and the code reads from top to bottom, which is more in-line with how the script actually runs.
In a more complex/realistic situation, we can now attach actions to each breakpoint by using lift:
script :: Builder ()
script = flip runContT delete $ do
  bp1 <- ContT $ withBreakpoint (Function "func1")
  lift $ do
    -- ... actions to run for breakpoint 1
    print "x"
    print "y"

  bp2 <- ContT $ withBreakpoint (Function "func2")
  lift $ do
    _  -- ... actions to run for breakpoint 2

  pure [bp1, bp2]
This generates the GDB script below:
break func1
set $var0 = $bpnum
command $var0
    # ... actions for breakpoint 1
    print x
    print y

    break func2
    set $var1 = $bpnum
    command $var1
        # ... actions for breakpoint 2

        delete $var0 $var1
    end
end
Note also how the breakpoints are automatically cleaned up at the right location by passing in the delete function to runContT. This is another feature we got for free by making use of the continuation monad. Neat!
Conclusion
In this post I showed how we can make use of the new debugger-hs library to create complex GDB scripts with little effort. The library is still in early stages, but it can already generate complex scripts thanks to Haskell's powerful abstraction capabilities and ecosystem. Some features I still plan to add to the library are LLDB support, increasing the coverage of GDB statements in the EDSL and improving the type safety in some places to prevent mistakes at compile time in Haskell.
If you need to use a debugger often and are unhappy with what GDB provides by default, give this library a shot and let me know on Twitter how it went!